Marginal Emissions Rates: See Carbon Emissions with Clarity in Real Time


Contents
A new chapter in our emissions accounting
Have you checked out Akamai’s 2024 greenhouse gas (GHG) emissions and energy assurance statement? If you’ve been following closely, you may have noticed some new impact information. These updates reflect our work to improve both the transparency and accuracy of our emissions footprint.
For the last decade, we’ve reported and verified our Scope 1, Scope 2 (location- and market-based), and Scope 3 emissions inventory. This year, for the first time, we’ve also received third-party verification on a marginal emissions impact figure for our electricity-based categories.
What are marginal emissions rates?
Traditionally, companies rely on annual static emissions factors, which represent an average of the grid’s generation mix and are often published more than a year after the generation took place. Marginal emissions rates, on the other hand, are more granular: They identify the carbon impact of consuming or generating electricity at a specific time and location.
In simple terms, marginal emissions show the real-time effect on the grid, not just the yearly average. We use these data points both to calculate the emissions from our electricity use and to measure the avoided emissions from the renewable energy projects in which we’ve invested.
Comparing renewable energy impacts
With marginal emissions data, we can compare the true performance of renewable projects throughout the year. For example, here’s how our Green River Wind project in Illinois looks when comparing the latest available factors from the EPA’s Emissions & Generation Resource Integrated Database (eGRID) against hourly locational marginal emissions (LME) values for May 2025 (Table 1).
Emissions avoidance (MT CO2e) |
|
eGRID (2023) |
726 |
LMEs from REsurety (May 2025) |
627 |
MT CO2e denotes a metric tonne of carbon dioxide equivalent
Table 1: Emissions data comparison for Akamai’s Green River Wind project
Using the annual eGRID factors, the project appears to avoid 726 MT of CO2e. With marginal factors captured and validated within the month the generation occurred, however, the real impact is 627 MT, a difference of 99 MT in just one month.
In tracking progress toward our net-zero targets, we deliberately don’t claim the extra 99 MT, because it doesn’t reflect the real impact of our project on the grid and our goal is accuracy not progress inflation.
Less than 100 MT, may not sound like much, but across projects and months, these differences add up. In Figure 1, you can see how our US renewable portfolio compared in 2024 using traditional factors versus marginal emissions rates.
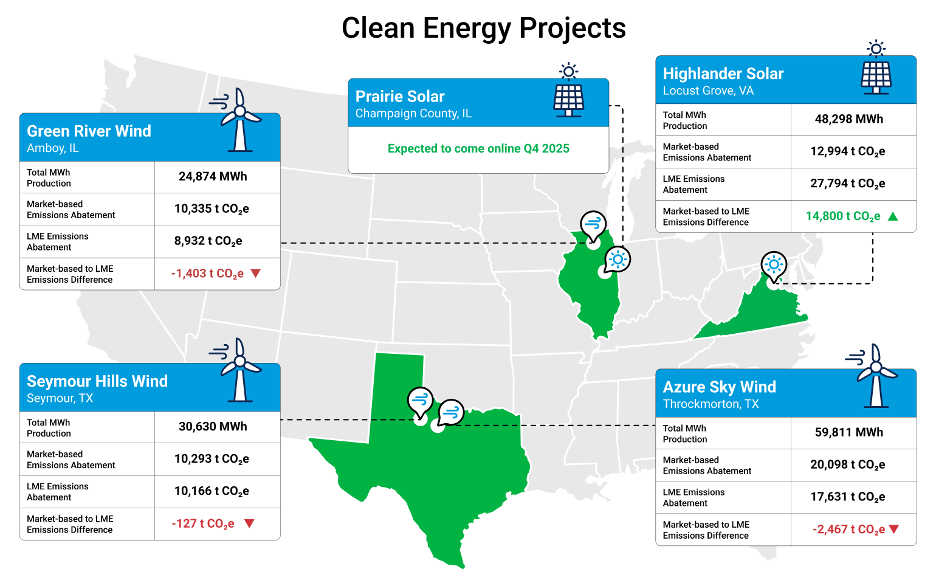
Fig. 1: The differences in emissions avoidance values for 2024 according to annual emissions factors versus marginal emissions rates
These differences reflect which generation sources are dispatched to the grid at specific times. More precise data allows us to make smarter decisions about where we invest in clean energy projects to maximize decarbonization, how we track performance, and how we use energy attribute certificates (EACs) to progress toward net zero.
Real-time data and net-zero emissions
It is important to us that we know the true impact of our actions. Combining marginal emissions rates with our real-time power consumption data allows us to better understand our global platform performance in terms of both power and carbon efficiency (Figure 2). These insights inform continual improvements across our services and operations.
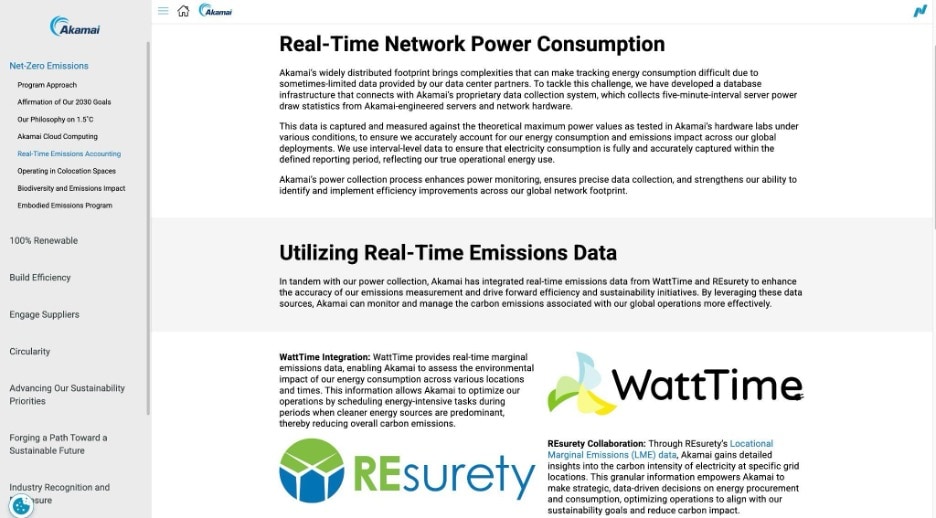
Fig. 2: We combine marginal emissions rates with our real-time power consumption data to better understand our global platform performance
By sharpening accuracy and transparency over the past several years, we now have more clarity than ever on what a true net zero means for Akamai, and we have greater ability to provide insights to support our customers.
More information on real-time energy and emissions tracking is available on our sustainability microsite. To learn more about marginal emissions rates, visit REesurety, WattTime, and Emissions First.
How we calculate our marginal emissions impact
In our 2024 emissions statement, we introduced new metrics showcasing our marginal emissions impact. This consequential-based approach combines both our emissions inventory and the effect of our interventions into one impact value.
Table 2 shows what the formula for calculating emissions impact looks like at a high level.
Induced emission = electricity consumption × MER |
Avoided emissions = renewable generation × MER |
Marginal emissions impact = induced – avoided |
MER denotes marginal emissions rate
Table 2: How we calculate our marginal emissions impact
Applying marginal emissions rates to our electricity consumption and renewable energy generation with data from WattTime and REsurety provides us with a more precise picture of our global impact.
The case for change
At Akamai, we believe this consequential-based approach is critical because it:
- Provides real-time insights that are unavailable from annual emissions factors
- Allows us to directly compare induced vs. avoided emissions with greater granularity
- Offers what we believe is the most accurate view of our GHG impact from both consumption and procurement actions
- Guides better decision-making to help us prioritize the most impactful steps toward decarbonization
Our focus on marginal emissions comes as the Greenhouse Gas (GHG) Protocol considers revisions to its Scope 2 standard. We support approaches that emphasize accuracy and transparency, capturing not only emissions inventories, but also the real-world impact of interventions to ensure we incentivize decarbonization.
Looking ahead