

Background

Air Traffic Stopped. Web Traffic Soared.

November 16, 2026 by Ryan Gao

Share

At 3:54 PM ET on Friday, November 13, 2026, every airline departure in the United States stopped. About 11,000 flights were still scheduled to leave after 4 PM ET, carrying about 1.5 million passengers, according to Cirium data reported by CNBC.

The sky had stopped. The internet had to keep going.

Flight status checks and rebookings hit airline sites and apps within minutes. In the first hour, our edge traffic to major airlines was increased by 1.4 times as the same hour on the day before. By 8 PM ET, it was 1.8 times. On Saturday, it was still about 1.5 times higher than a normal Saturday.

The internet did not cause the ground stop; air traffic control runs on its own dedicated network. But once that network failed, airline apps and websites became the main line among travelers and their airlines.

Digital resilience in practice

That is digital resilience in practice: absorbing demand nobody planned for, at the moment people need it most, without slowing down or breaking. It is the work our distributed platform does every day for airlines and other travel companies. On November 13, as major airlines’ web traffic climbed on our platform, server errors stayed low — at or below the level of a normal Friday.

Here is what the surge looked like, what travelers searched for, and what it means for the next disruption.

What happened

The U.S. Federal Aviation Administration halted all U.S. departures from 3:54 PM to 8:15 PM ET. Its initial investigation points to a newly installed router at a site in El Dorado, Arkansas, which flooded the air traffic control network with data. That network is separate from the public internet.

The demand shock

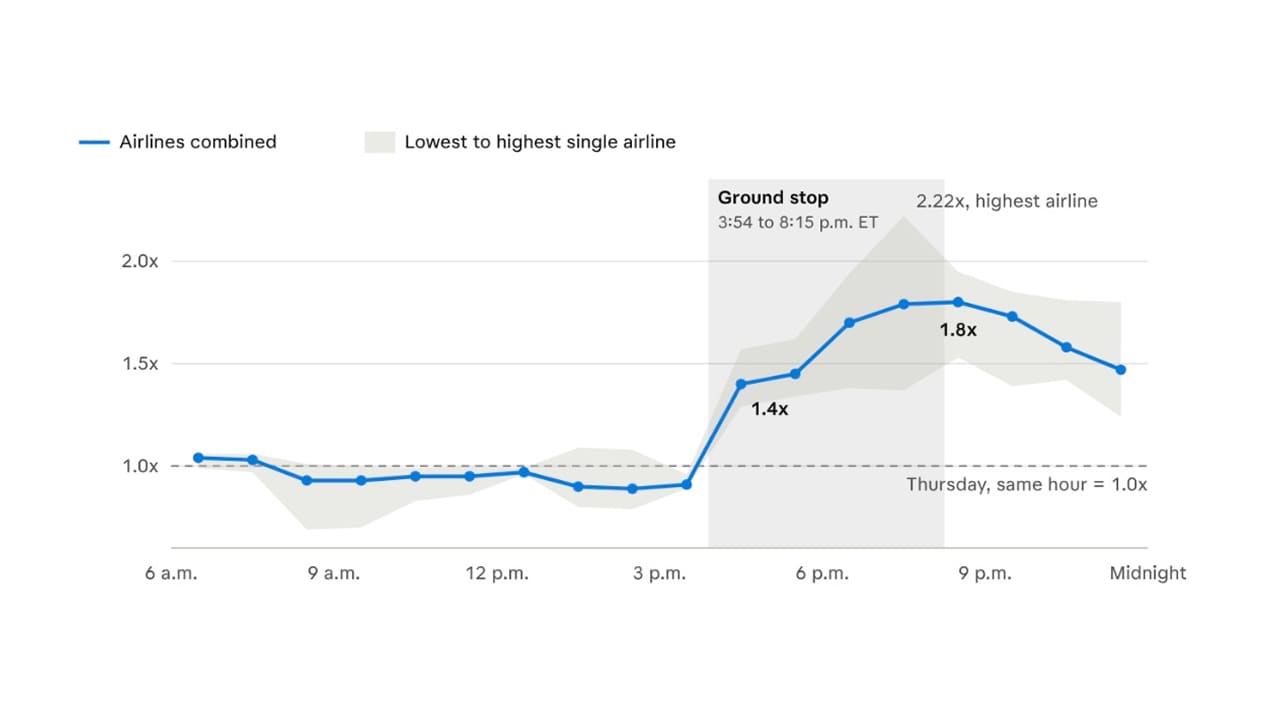
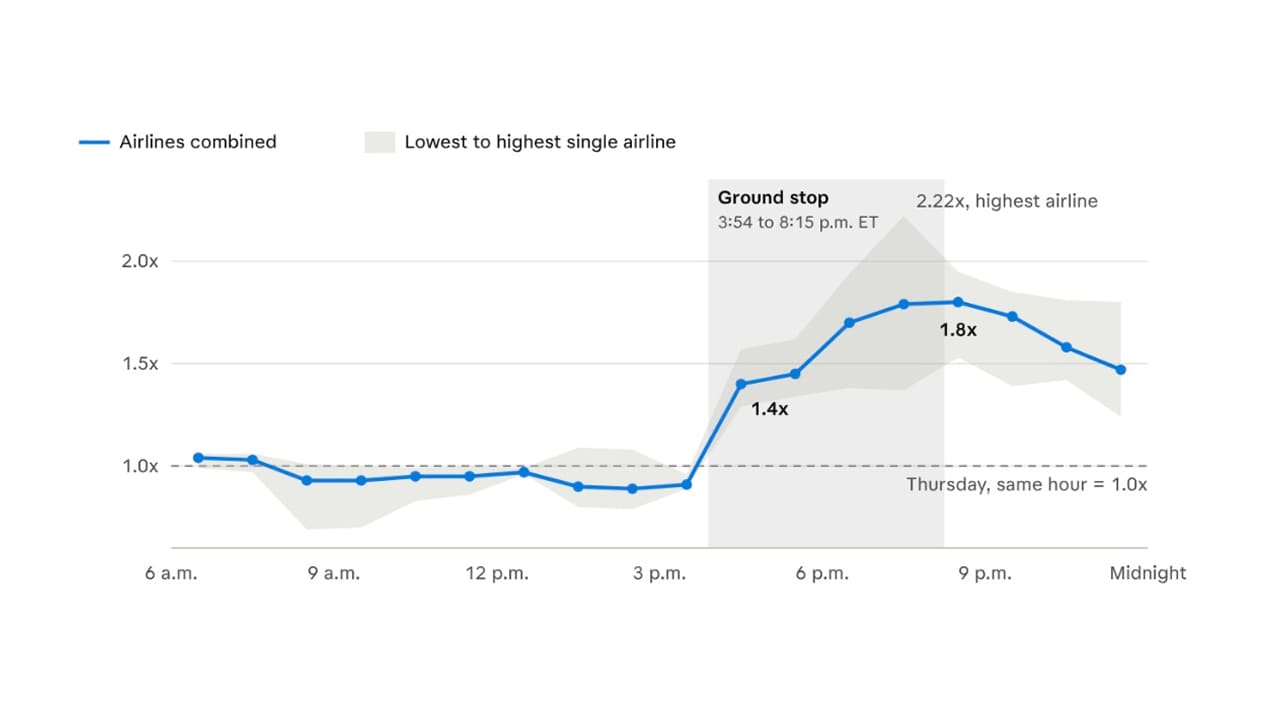
In the 4 PM hour, minutes after the order, airline edge traffic jumped to 1.4 times as much as the same hour on Thursday. It kept climbing for four hours (Figure 1).

In the 4 PM hour, minutes after the order, airline edge traffic jumped to 1.4 times as much as the same hour on Thursday. It kept climbing for four hours (Figure 1).
Fig. 1: Edge requests per hour on Friday, November 13 vs. the same hour on Thursday, November 12, 6 AM to midnight ET
In the 4 PM hour, minutes after the order, airline edge traffic jumped to 1.4 times as much as the same hour on Thursday. It kept climbing for four hours (Figure 1).

Through Friday evening, compared with the same hour on Thursday:

  • Combined traffic peaked at 1.8x between 8 PM and 9 PM ET, as the stop was lifted, and was still 1.5x in the last hour of the day.

  • Individual airlines peaked between 1.6x and 2.2x.

  • The busiest hour, 6 PM to 7 PM ET, carried 1.5 times the volume of Thursday's busiest hour.

  • Mobile hostnames grew fastest at two airlines, at 2.0x and 1.7x from 4 PM to 9 PM ET.

  • Traffic to in-flight Wi-Fi portals fell to about one third of Thursday's level.

The demand outlasted the stop by more than a day. From 7 AM to 7 PM ET on Saturday, combined airline traffic ran 1.48 times the three prior Saturdays, and 1.30x to 1.61x at individual airlines.

What travelers searched for

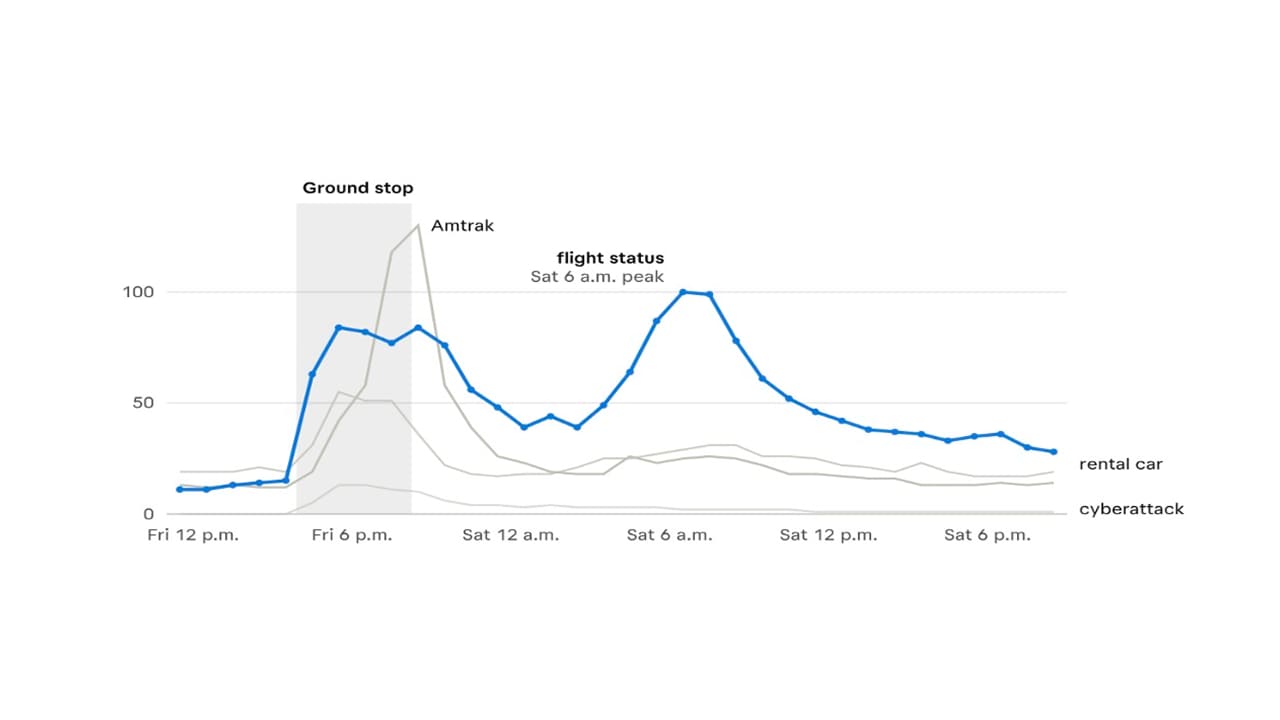
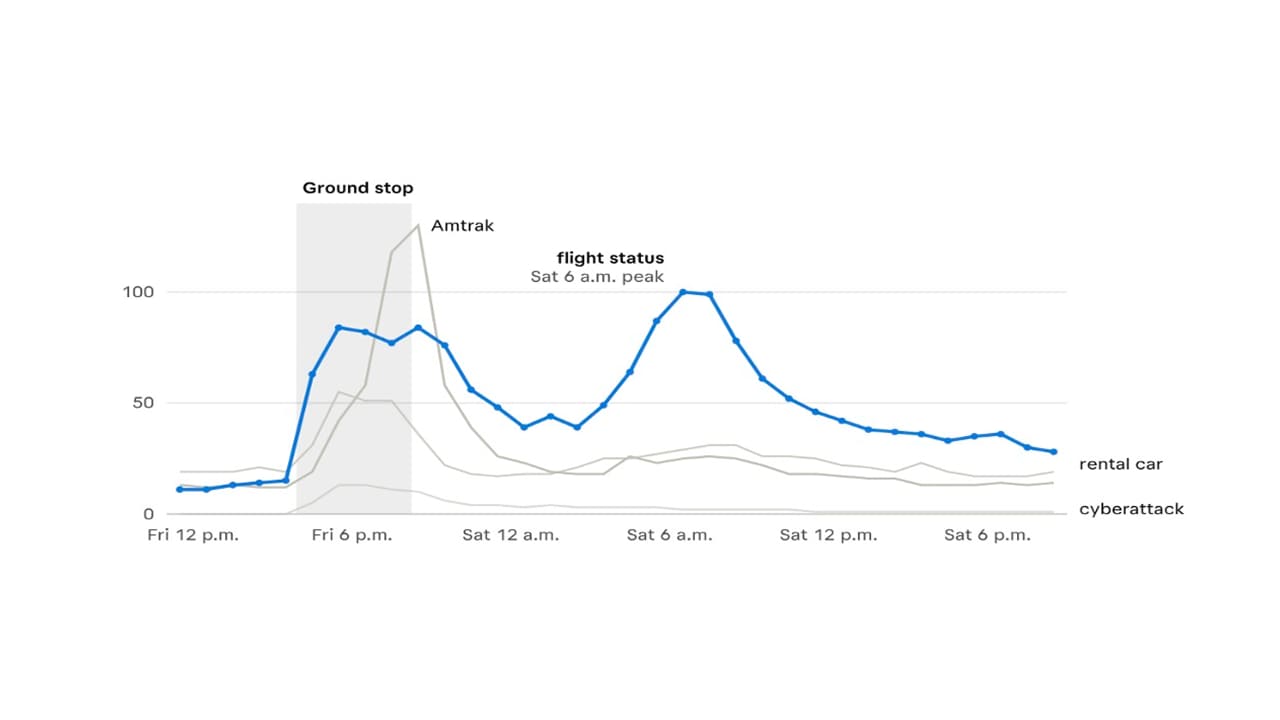
Other sources saw their traffic increase as well…Google searches in the United States for “flight status” were 4.7 times higher between 5 PM and 6 PM ET on Friday than in the same hour on Thursday (Figure 2). Search interest in “ground stop” peaked in the 4 PM hour, minutes after the order. (Source queries [Google Trends, United States, past 7 days, pulled November 15, 2026]: flight status set, ground stop set, alternatives set, cyberattack set.)

Other sources saw their traffic increase as well…Google searches in the United States for “flight status” were 4.7 times higher between 5 PM and 6 PM ET on Friday than in the same hour on Thursday (Figure 2).
Fig. 2: Google Trends (trends.google.com), United States, past-7-days hourly view, pulled Nov 15, 2026; Amtrak and rental car rescaled from a second query that shared the flight status term
Other sources saw their traffic increase as well…Google searches in the United States for “flight status” were 4.7 times higher between 5 PM and 6 PM ET on Friday than in the same hour on Thursday (Figure 2).

Three other signals stand out in the search data:

  • Alternatives: “Amtrak” searches rose about tenfold and peaked at 8 PM ET; "rental car" searches nearly tripled at 5 PM.

  • The cyberattack question: Interest in “cyberattack” rose from near zero to 13% of the peak search interest in “flight status” between 5 PM and 7 PM ET, then faded as officials said there was no indication of an attack.

  • The morning after: “Flight status” peaked again at 6 AM ET Saturday, 7.1 times higher than during the same hour on Thursday, as travelers checked rebooked flights.

Rising related queries for “flight status” included “faa flight status” and “faa updates” (both breakout) and “faa flight delays” (+3,200%), showing travelers turning to the FAA as a primary source.

The actions the travelers took

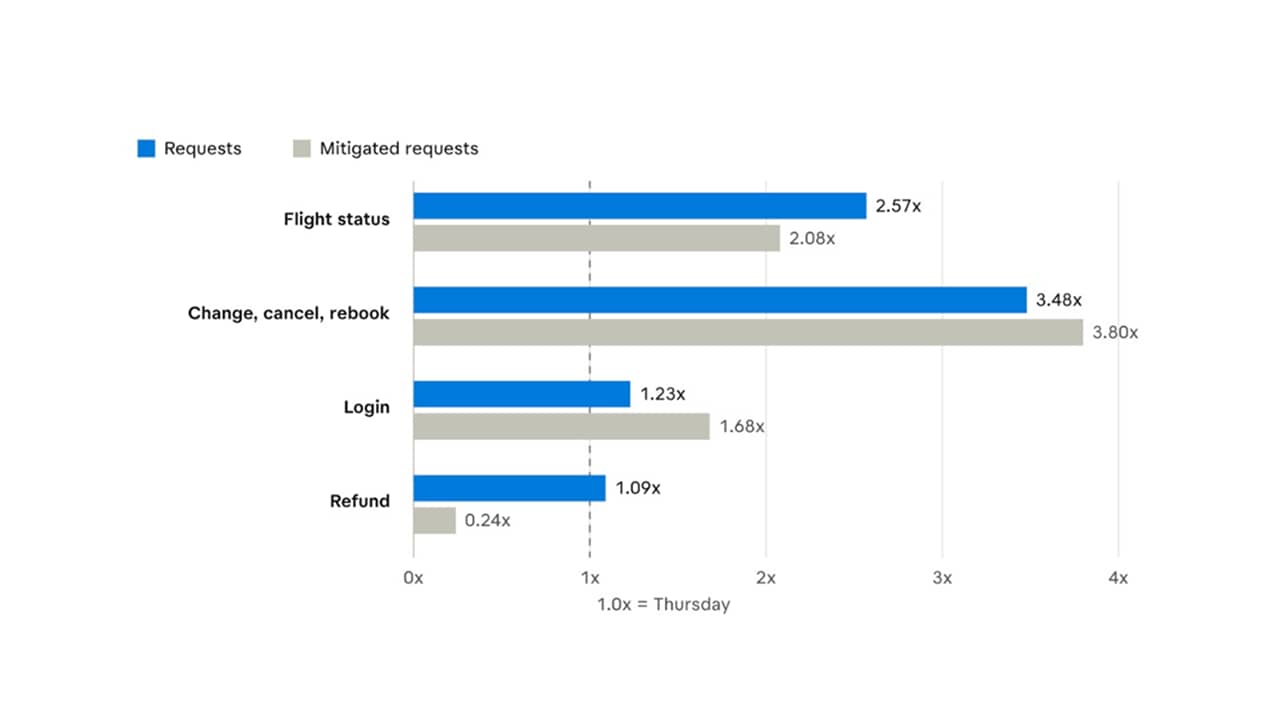
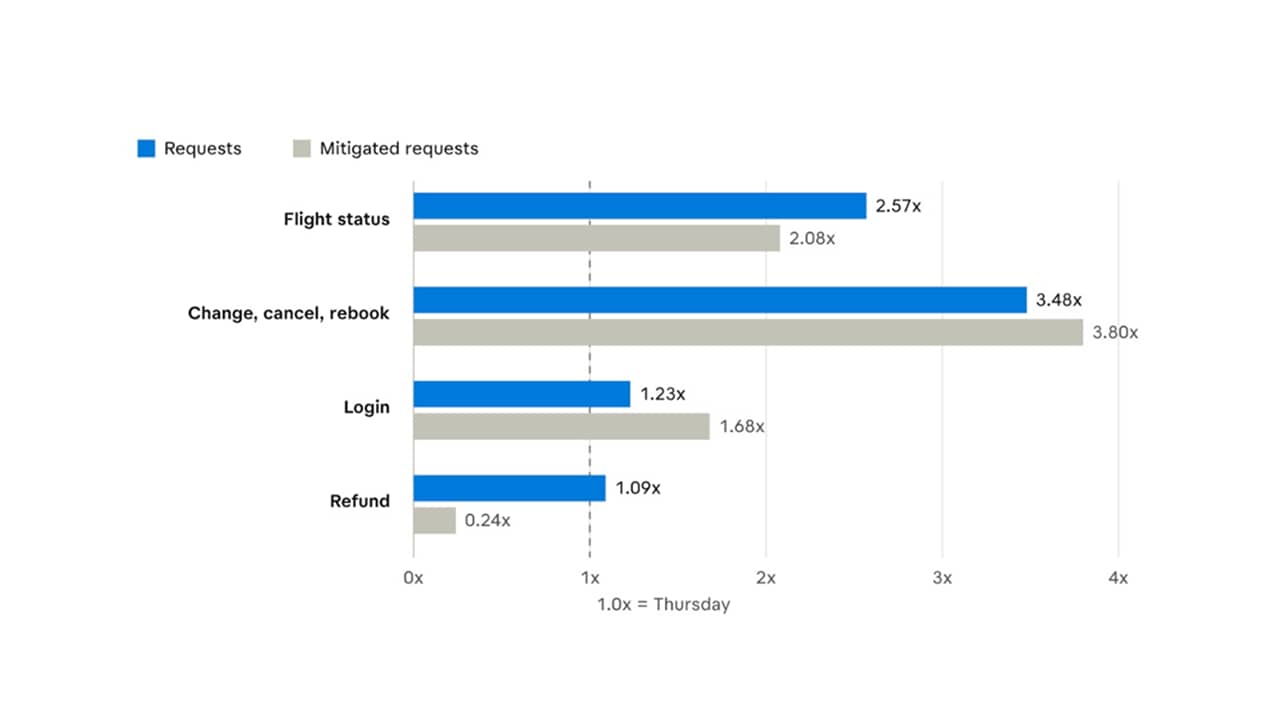
According to our study of major airlines, endpoints that report flight status and handle trip changes had the highest increase of requests (Figure 3).

According to our study of major airlines, endpoints that report flight status and handle trip changes had the highest increase of requests (Figure 3).
Fig. 3: Akamai Web Security Analytics, requests grouped into transactional functions (flight status; change, cancel and rebook; login; refund) on customer-facing web and API endpoints, Friday, November 13 vs Thursday, November 12, 4 PM to 9 PM ET, major North American airlines combined; mitigated = denied, challenged, tarpitted, or slowed by security policy for blocking malicious automation
According to our study of major airlines, endpoints that report flight status and handle trip changes had the highest increase of requests (Figure 3).

By function, across the airlines, these types of requests increased the most:

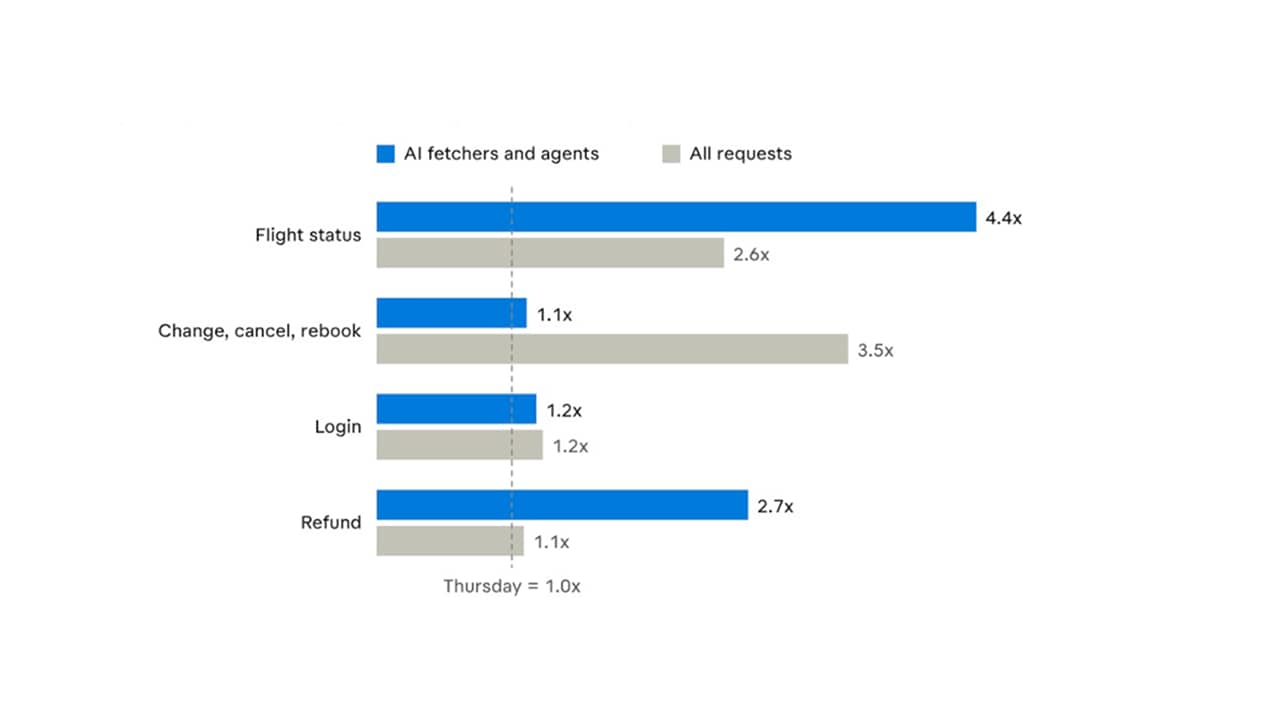
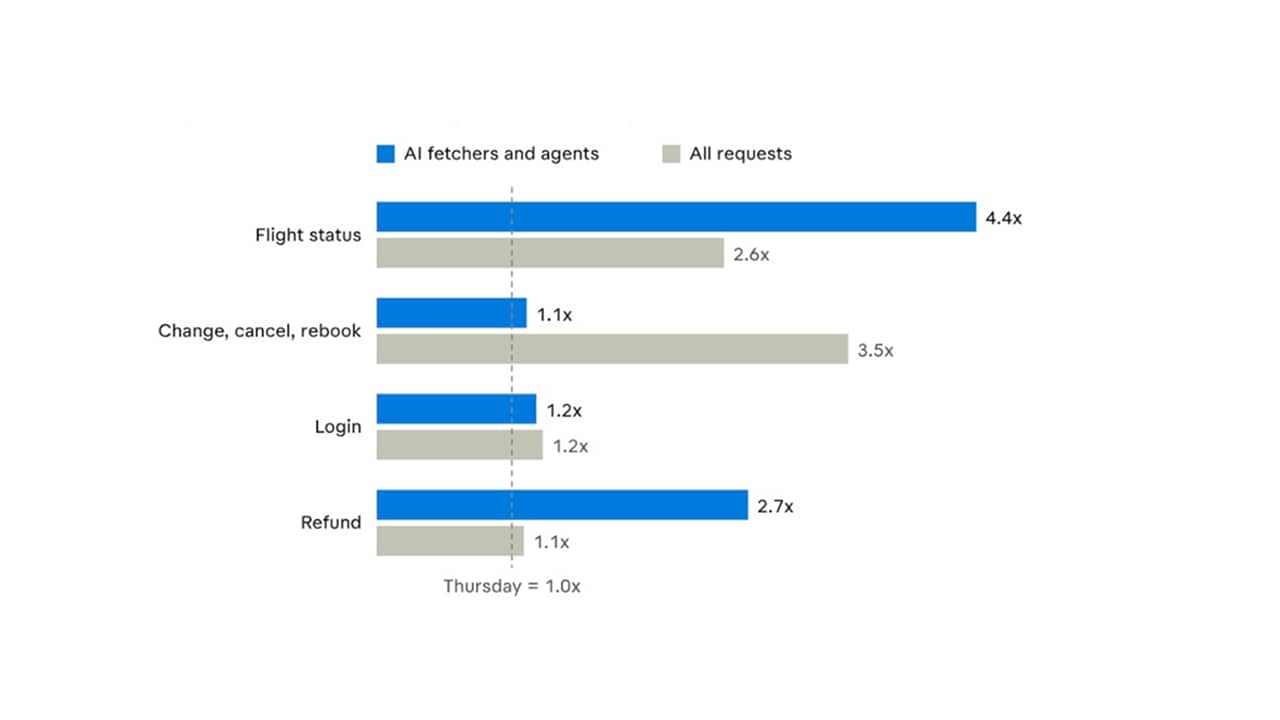
  • Flight status: Requests rose 2.6x combined and between 2.0x and 6.6x at individual airlines.

  • Change, cancel, and rebook: Requests rose 3.5x combined and between 2.8x and 15x at individual airlines. At one airline, change and re-accommodation paths on its mobile check-in API rose 5.2x.

  • Login: Requests rose 1.2x combined.

  • Refund: Volumes were small and mixed, from 0.85x to 4.3x at individual airlines.

Delivery and user experience

Several of the airlines run Akamai Visitor Prioritization in front of their web applications. It works as a shock absorber for the origin. When demand passes the capacity an airline has set, Visitor Prioritization sends the overflow to a waiting room in the airline's own branding and admits visitors as capacity frees up. Travelers get a short, explained wait instead of an error page or a site that stops responding.

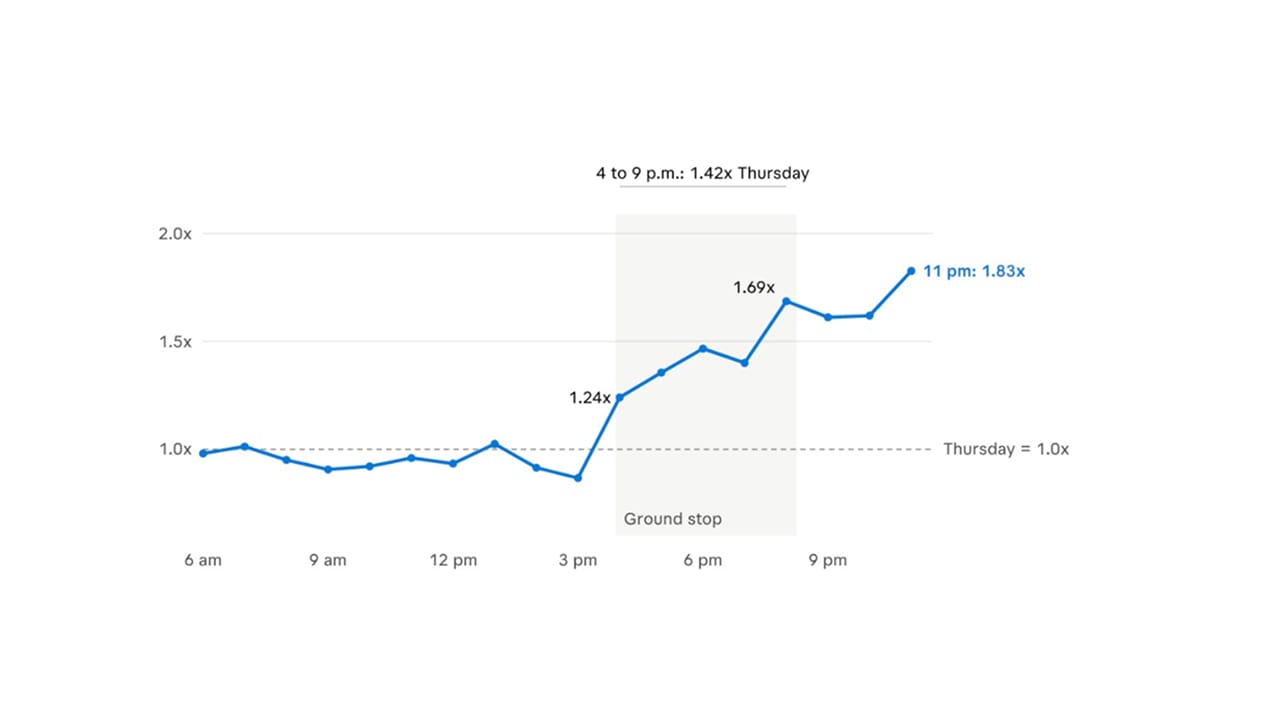
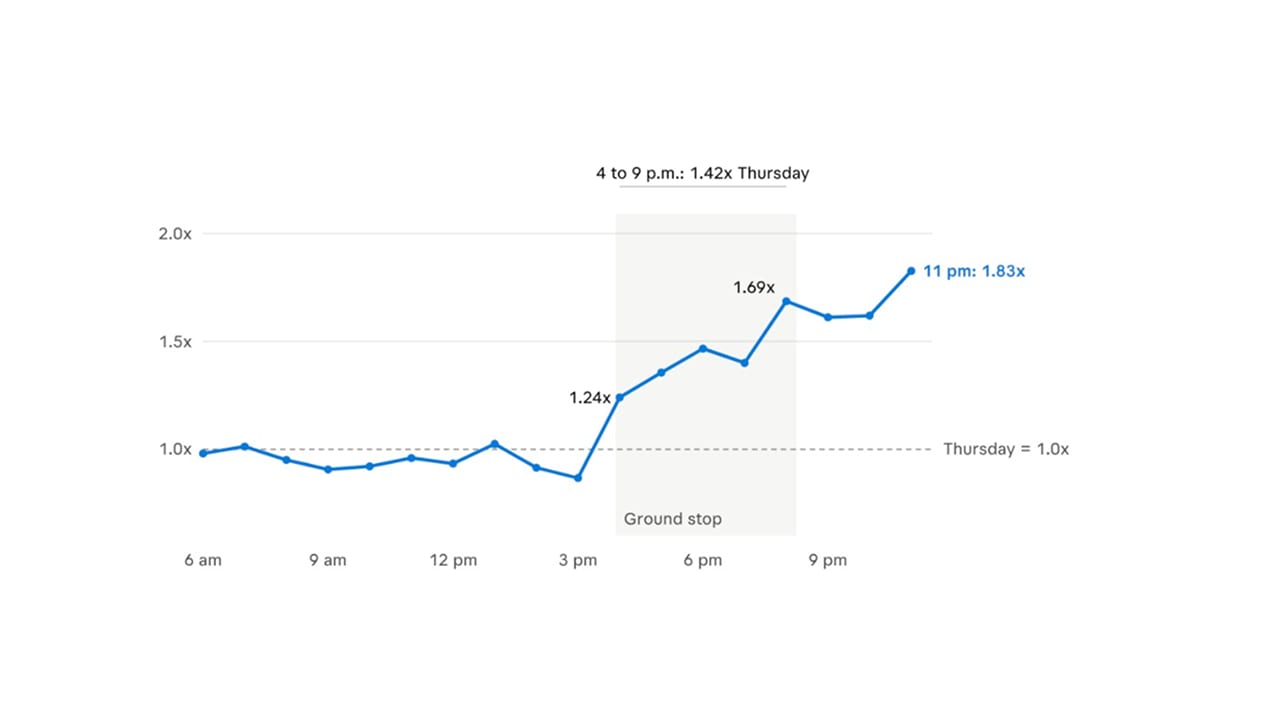
Across the airlines, traffic through Visitor Prioritization ran 1.42 times higher than Thursday from 4 PM to 9 PM ET and peaked in volume in the 8 PM hour. Traffic eased after 9 PM but stayed well above Thursday's level through midnight. Both of the airline’s sites kept serving travelers through the peak (Figure 4).

Across the airlines, traffic through Visitor Prioritization ran 1.42 times higher than Thursday from 4 PM to 9 PM ET and peaked in volume in the 8 PM hour. Traffic eased after 9 PM but stayed well above Thursday's level through midnight. Both of the airline’s sites kept serving travelers through the peak (Figure 4).
Fig. 4: Per Akamai Visitor Prioritization, total requests per hour across two major North American airlines, Friday, November 13 vs Thursday November 12, 6 AM to 6 PM ET
Across the airlines, traffic through Visitor Prioritization ran 1.42 times higher than Thursday from 4 PM to 9 PM ET and peaked in volume in the 8 PM hour. Traffic eased after 9 PM but stayed well above Thursday's level through midnight. Both of the airline’s sites kept serving travelers through the peak (Figure 4).

AI agents in the surge

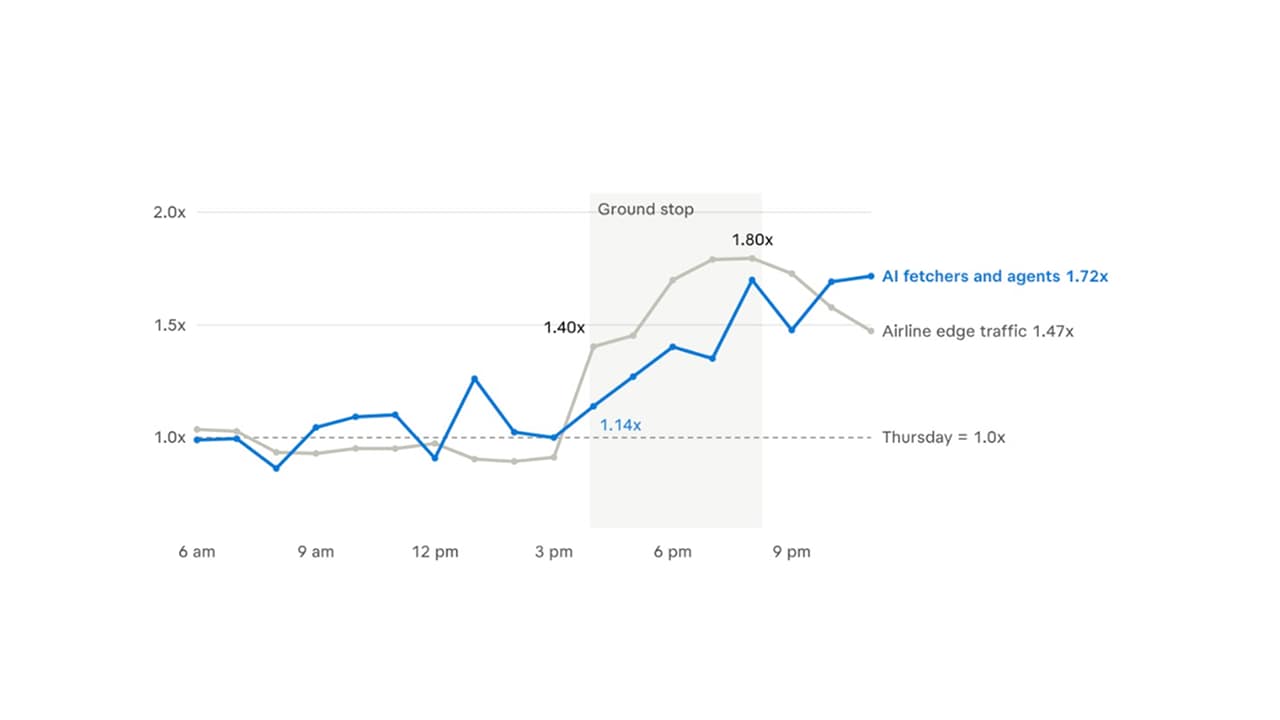
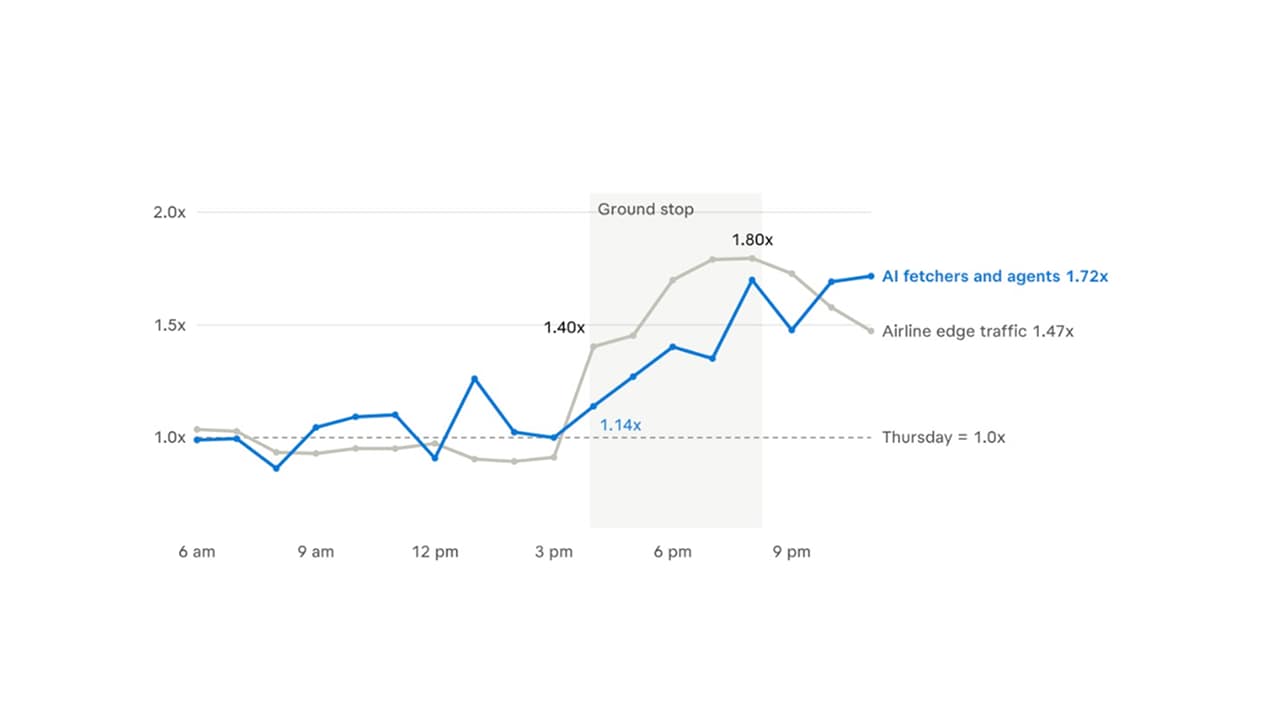
Travelers also used AI assistants. AI agent traffic rose later than airline traffic and stayed elevated (1.5x to 1.7x) to midnight (Figure 5).

Travelers also used AI assistants. AI agent traffic rose later than airline traffic and stayed elevated (1.5x to 1.7x) to midnight (Figure 5).
Fig. 5: Per Akamai edge delivery logs (airline edge traffic, hostnames that rose significantly) and Akamai Web Security Analytics (AI Fetchers and Agents bot category), Friday, November 13 vs Thursday, November 12, 6 AM to midnight ET, major North American airlines combined
Travelers also used AI assistants. AI agent traffic rose later than airline traffic and stayed elevated (1.5x to 1.7x) to midnight (Figure 5).

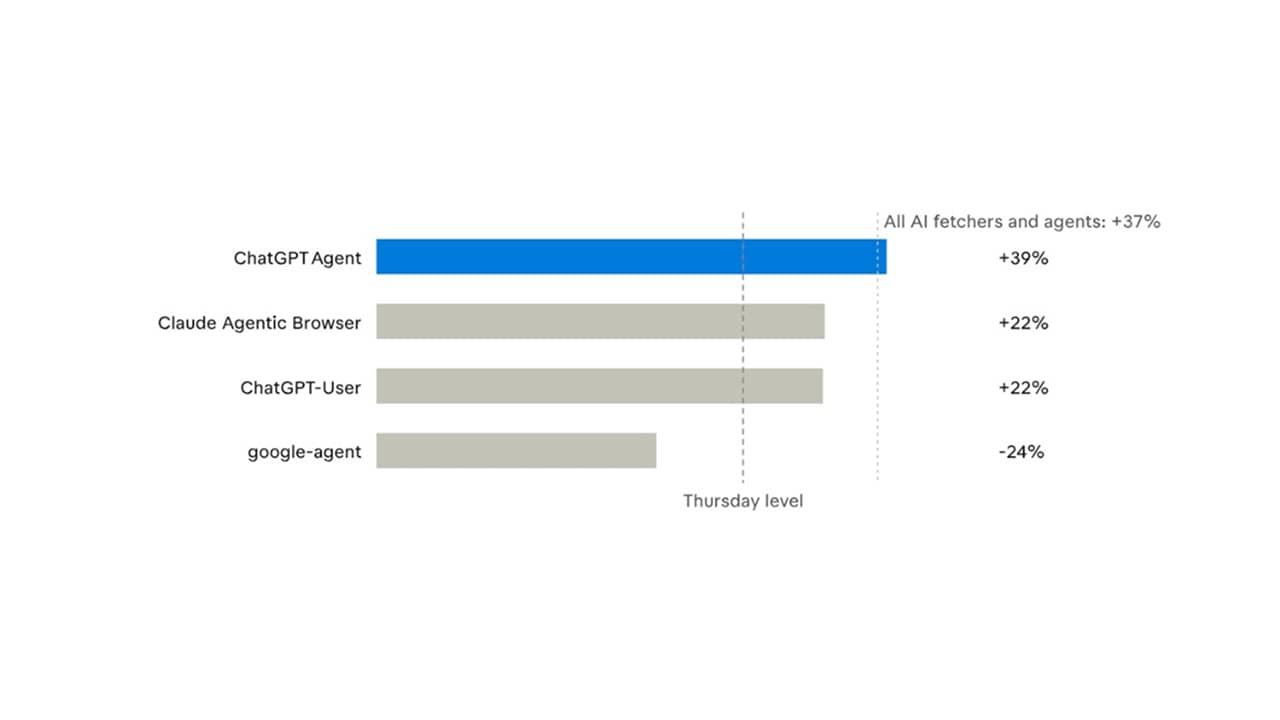
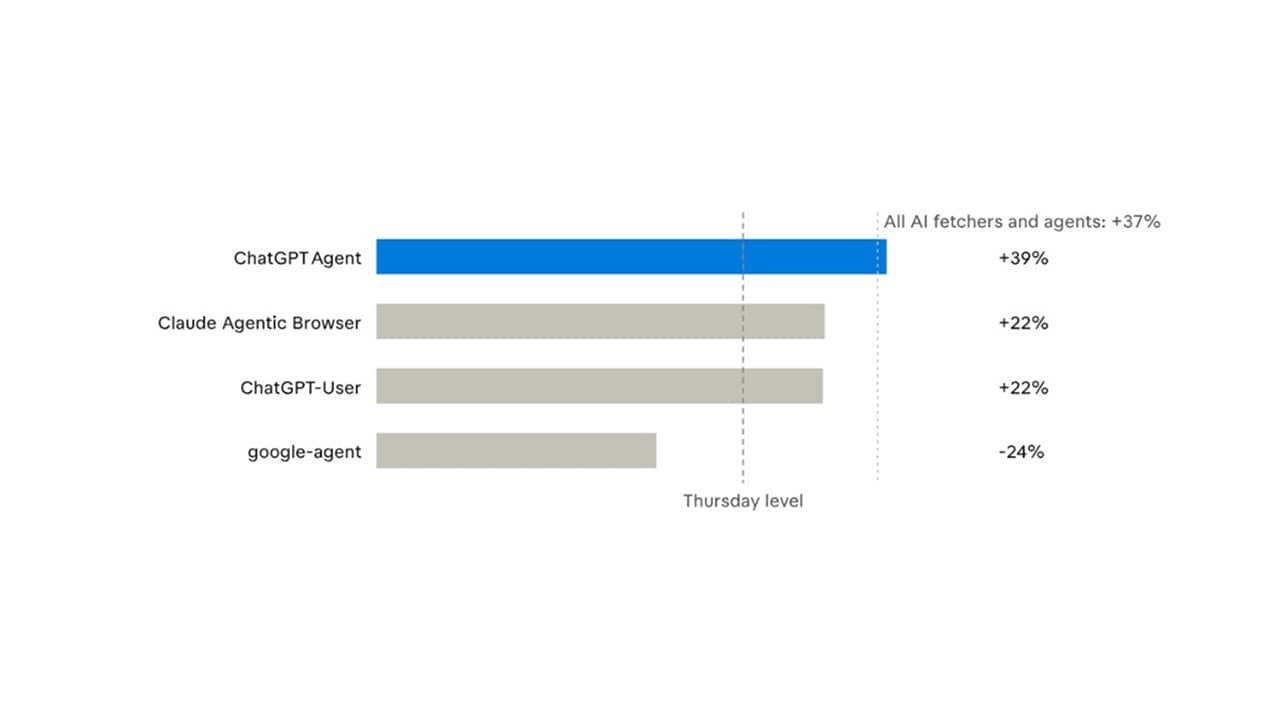
Over the 4 PM to 9 PM window, individual airlines’ AI agent use ranged from 1.14x to 1.80x. AI agent requests to flight status grew faster than all requests to those endpoints (4.4x vs 2.6 x for all requests; Figure 6), and ChatGPT Agent grew the most among the largest agents (39% above Thursday; Figure 7).

AI agent requests to flight status grew faster than all requests to those endpoints (4.4x vs 2.6 x for all requests; Figure 6), and ChatGPT Agent grew the most among the largest agents (39% above Thursday; Figure 7).
Fig. 6: Per Akamai Web Security Analytics, requests matched by path keyword on customer-facing hostnames, AI Fetchers and Agents bot category vs all requests, Friday, November 13 vs Thursday, Nov 12, 4 PM to 9 PM ET, major North American airlines combined
AI agent requests to flight status grew faster than all requests to those endpoints (4.4x vs 2.6 x for all requests; Figure 6), and ChatGPT Agent grew the most among the largest agents (39% above Thursday; Figure 7).
Fig. 7: Per Akamai Web Security Analytics, AI Fetchers and Agents bot category by Akamai bot name, Friday, November 13 vs Thursday, November 12, 4 PM to 9 PM ET, major North American airlines combined
AI agent requests to flight status grew faster than all requests to those endpoints (4.4x vs 2.6 x for all requests; Figure 6), and ChatGPT Agent grew the most among the largest agents (39% above Thursday; Figure 7).

Opportunistic bot attacks targeted transactional endpoints

Automated traffic followed travelers to the same endpoints. On Friday, across the airlines, mitigated requests rose 2.1x on flight-status endpoints and 3.8x on change, cancel, and rebook endpoints, compared with Thursday. Disruptions tend to draw this kind of activity. While airlines are issuing credits and refunds at scale, login, rebooking and refund flows become more attractive targets, and the surge of legitimate traffic makes automated requests harder to spot.

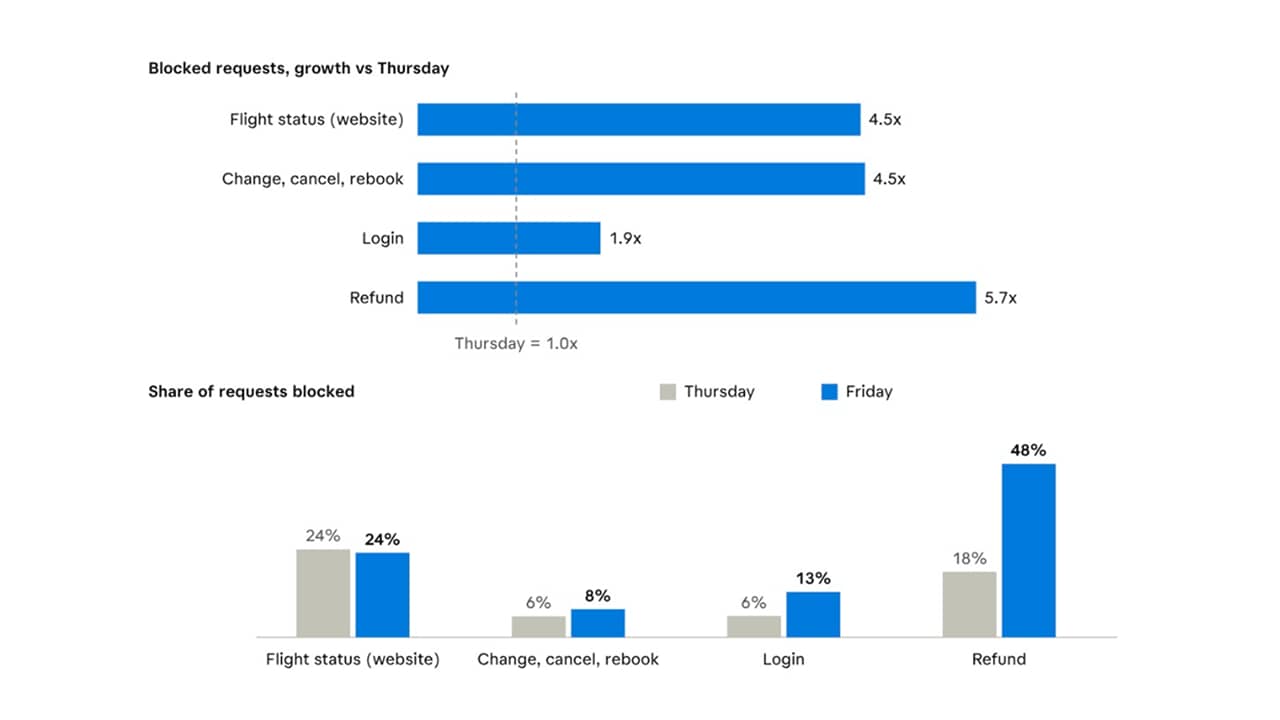
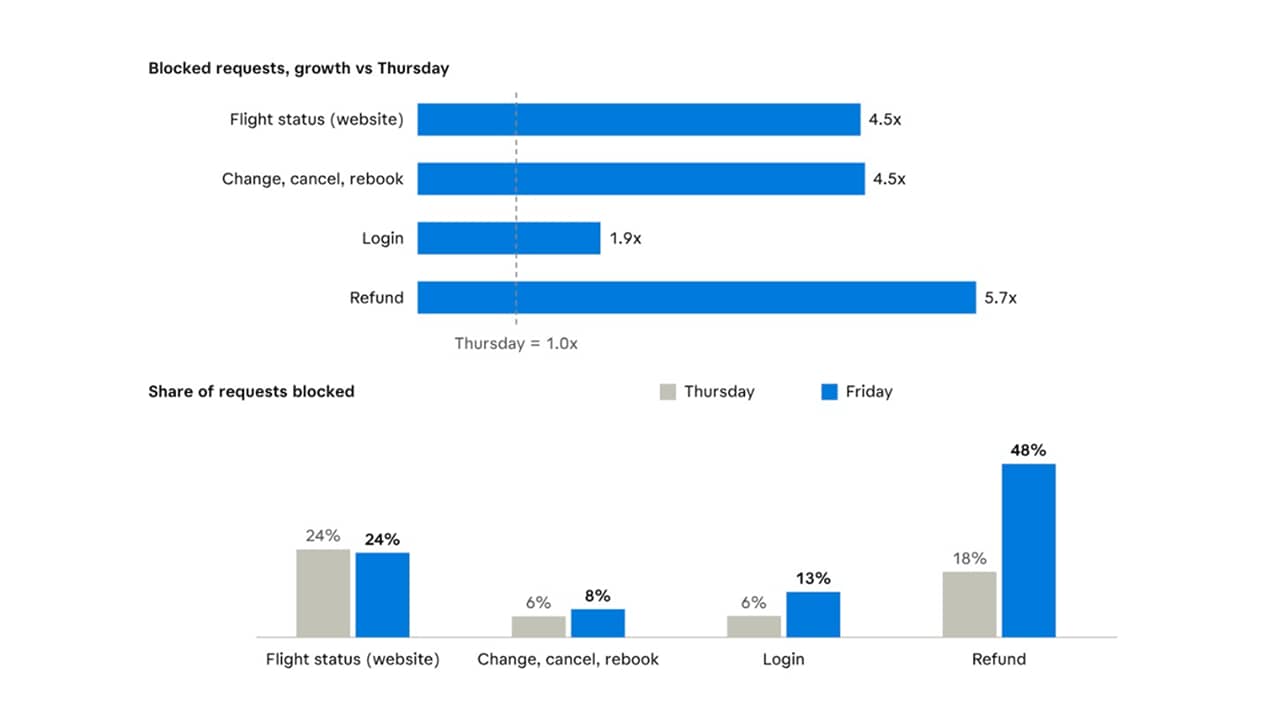
Figure 8 looks at two of the airlines: one for flight status and trip changes, the other for login and refunds. Blocked requests rose on every path shown, most on refund.

 Figure 8 looks at two of the airlines: one for flight status and trip changes, the other for login and refunds. Blocked requests rose on every path shown, most on refund.
Fig. 8: Per Akamai Web Security Analytics, requests matched by path keyword, Friday, November 13 vs Thursday, November 12, 4 PM to 9 PM ET; blocked = denied, challenged, tarpitted, or slowed by security policy; flight status = one airline's website hostname; other functions = all customer-facing hostnames of the airline shown
 Figure 8 looks at two of the airlines: one for flight status and trip changes, the other for login and refunds. Blocked requests rose on every path shown, most on refund.

Built for the unplanned peak

Disruptions move demand online within minutes, and the load can last more than a day. Akamai helps airlines and travel platforms stay available by:

  • Absorbing the surge: A globally distributed edge serves travelers close to where they are, so demand nobody planned for does not become an outage. Visitor Prioritization adds a branded waiting room for the moments when demand outruns what origin servers can take.

  • Protecting the paths travelers need: API and bot protection keep flight status, rebooking, and login working while automated abuse is blocked.

  • Seeing it as it happens: Real-time traffic and security analytics show a surge as it starts, in time to respond.

Akamai delivers and protects the digital services of airlines and travel platforms worldwide. On November 13, 2026, while air traffic was halted, the services we provided kept serving travelers through loads well above normal, with server errors at normal levels.

Prepare for the next disruption before it happens 

The Akamai Threat Intelligence Service (ATIS) can brief your team on what attackers target during unplanned events.

Talk to your Akamai account team about the Visitor Prioritization Cloudlet, Akamai App & API Protector, and Akamai Bot Manager to protect the paths travelers rely on most. 

For related guidance, read our blog posts on the anatomy of peak traffic and operating beyond predictable peak seasons.

About the author

Ryan Gao

Ryan Gao

Ryan Gao is a Strategic Engagement Manager in Akamai’s Global Services organization. He built and leads the Akamai Threat Intelligence Service (ATIS), which delivers actionable, field-based security intelligence backed by telemetry from the Akamai global platform.

With more than 10 years of experience, Ryan focuses on threat intelligence research, industry security metrics, and security operations trends in the AI era. His work helps financial-sector security teams understand emerging threats and put advanced security measures into practice.

Ryan contributes to internet safety through community support in professional forums, and works with industry peers to develop cybersecurity best practices.