Key takeaways
Self-hosting a large language model (LLM) endpoint is straightforward to start, but production traffic exposes bottlenecks that traditional web service monitoring may miss.
The performance of LLM inference is dictated by GPU memory bandwidth, key value cache availability, and batching dynamics, rather than traditional metrics like CPU use or network request volume.
Under load, an LLM endpoint may continue returning 200 OK while latency quietly climbs to unusable levels.
vLLM’s continuous batching makes GPU use far more efficient, but batching also has a cliff where throughput flattens and tail latency rises.
Production inference needs bounded admission, context limits, and queueing outside the engine so degraded requests can be controlled before they become silent failures.
This year I’ve been focused on self-hosted AI, looking past agent runtimes at the underlying inference layer. My goal has been to understand how to self-host models that actually fit on a GPU along with their context, while providing a great user inference experience to customers. At scale, that gets complicated quickly.
I spoke on this topic at KubeCrash Spring 2026 and got more questions from developers than I had time to answer. Some had privacy requirements, some were watching their per-token bill climb every month, and others had compliance rules that don't allow prompts to leave their own infrastructure. They all boiled down to the same question: What does it actually take to run LLMs in-house?
I’m a builder, so my answer to this challenge was simple: Build it. I developed a real LLM endpoint on a real GPU on Kubernetes. To take it even further, I created fluctuating workloads. Then I broke the whole thing.
Here’s what I learned.
Start with the right hardware assumptions
Another common question I get is about the need to use a GPU for inference versus a CPU, especially when teams already have them and they’re less expensive.
It’s a fair question, and the answer comes down to two things that show up later in this post as failure modes: parallelism and memory bandwidth.
The first is parallelism. A CPU has a handful of powerful cores built to handle different tasks quickly and successively. A GPU operates differently; it has thousands of smaller cores all built to do the same math on a lot of data at the same time. Inference is mostly one operation, matrix multiplication, running billions of times — exactly what a GPU is built for. Because a CPU will try to do that work sequentially, it will quickly fall behind.
The second reason is memory bandwidth. To generate text, the GPU has to read the entire model out of memory for every single token it produces (versus performing math on it).
To put that into context, a modern server CPU pulls approximately 50 to 100 GBps out of its RAM. The GPU used for this build moves 480 GBps, and high-end data center cards move over 3,000 GBps. The difference is a response that streams versus one that crawls.
In fact, memory bandwidth is the thread that runs through every failure mode in this post.
Use vLLM for production inference patterns
Many developers are running Ollama on a laptop. That works for a development environment, but for production workloads, you need high throughput and the ability to serve LLMs to hundreds of concurrent users simultaneously.
A virtual large language model (vLLM) applies a memory management technique called PagedAttention, which pages memory on demand instead of reserving fixed memory chunks for each user. As a result, vLLM can batch many user prompts through the same forward pass without queue bottlenecks.
vLLM also provides parallelism to distribute workloads across multiple GPUs. The main patterns are:
Tensor parallelism (TP) for low latency
Imagine having a 70B parameter model. Running this model at full precision would require a GPU that has 140 GB of VRAM. Quantization could help make it fit. However, if compute is constrained across smaller GPUs, TP can shard every layer across all available GPUs.
Then, when a computation happens, all GPUs work on their specific slice of the math simultaneously and synchronize. This reduces the time it takes to generate each token, making the model feel fast.
Pipeline parallelism (PP) for larger models. If a model is so big that it spills over into a second physical server, TP struggles because the network cables connecting the servers aren’t fast enough to handle the constant, microscopic syncing. PP solves this by slicing the model sequentially: Server A handles the first set of layers, then hands the baton to Server B, which handles the remaining layers.
Data parallelism (DP) for high traffic. If a model does fit on one GPU, but 1,000 users are hitting it, DP spins up complete, independent replicas of the model on every available GPU. This is what I used recently in a workshop.
Prefix caching for repeated prompts. Providers often offer prompt caching as a way to save on costs and improve application performance. Imagine an application sends a large system prompt every time the model is invoked. This gets expensive. Prefix caching stores the mathematical state of that prompt and shares it across all users, dropping time to first token (TTFT) to near zero.
Deploy the endpoint, then test beyond the first request
To get started, I deployed vLLM on Linode Kubernetes Engine (LKE). The setup used one GPU node, an NVIDIA RTX™ 4000 Ada Generation with 20 GB of VRAM, running Qwen2.5-7B-Instruct. I used Terraform as the infrastructure as code to bring up the cluster, created a few manifests to deploy the workload, and had an OpenAI-compatible endpoint answering requests about 10 minutes later.
# manifests/vllm-deployment.yaml
args:
  - --model=Qwen/Qwen2.5-7B-Instruct
  - --download-dir=/models
  - --api-key=$(VLLM_API_KEY)
  - --host=0.0.0.0
- --port=8000The entire serving config is only five lines of flags. We’ll revisit these at the end of this blog post to see that the fix for everything I am about to demonstrate is two more lines added to this block.
Once it was deployed, I sent a prompt. I received a clean response, and it took about 250 ms to receive the first token. The TTFT is a measurement that matters when serving inference or using a provider's inference in an application. At 250 ms, this felt fast. I thought I was done.
But not so fast. One request tells you almost nothing about how a model serves traffic. The challenges appear when the second, third, and fiftieth users show up, especially as larger contexts start passing to the model.
Watch for silent latency failures
After deploying this and overloading the LLM endpoint, the first thing I noticed was that it didn’t return errors. This is unlike traditional applications.
When a web service fails under load, it throws 500 errors and you figure out how to handle it in your application. But an LLM endpoint under load keeps returning 200 OK and just takes 30 seconds to respond. Dashboards can say everything is healthy with the API and cluster — meanwhile, every user is waiting. While this degradation is real, it’s invisible to traditional metrics monitoring.
There is not a single cause for why this is happening. And if you do not understand why it slows down, you cannot tell a slow endpoint from a broken one, and you cannot fix either of them.
Coming from a networking and infrastructure background, most of my instincts about scaling services helped here. They got in the way, though, when I attempted to troubleshoot the issue.
Web service | LLM inference | |
|---|---|---|
Bottleneck | CPU, network | GPU memory bandwidth |
Per-request cost | Roughly constant | Grows with context length |
Concurrency | Stateless | Per-request state held in GPU memory |
Failure under load | Returns 500 | Latency degrades silently |
Scaling | Add pods | Add pods and GPUs |
A web request is cheap, stateless, and predictable, but an LLM request holds state on the GPU for its entire life. It costs more as the conversation grows, and it competes with every other in-flight request for the same fixed pool of memory. As a result, treating it like a web service leads to expensive mistakes.
Understanding the 2 phases of inference
In AI, inference is the process of feeding a trained machine learning model a prompt and running it through its neural network so the model can make a prediction (generate an output). In generative AI, this runs in two phases — including prefill (key value cache) and decode — and each phase bottlenecks or fails for different reasons (Figure 1).
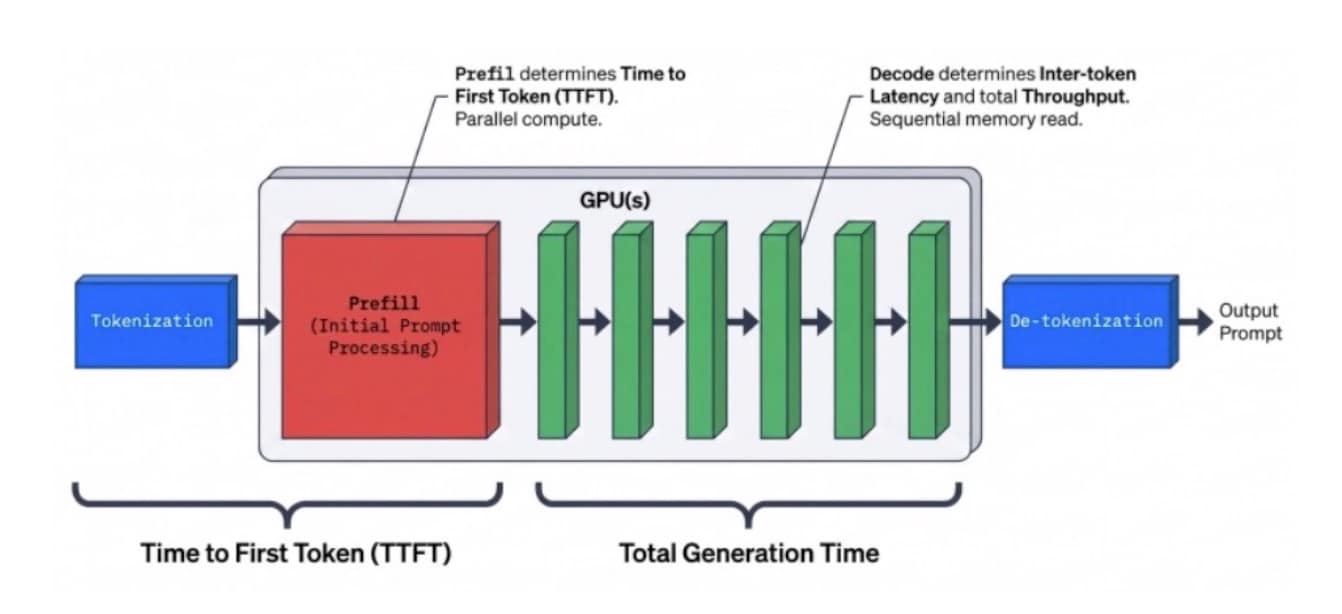 Fig. 1: The LLM inference pipeline, from processing the initial prompt to generating the final text
Prefill (key value cache): This phase processes the entire prompt to create the key value (KV) cache. It turns text into numbers and maps the relationships between tokens, such as the prompt, system prompt, and tools. It runs in parallel across every input token at once. It is compute heavy, and it drives TTFT.
Decode: This phase generates the response one token at a time. This happens after prefill and is sequential, meaning that each new token depends on every token before it. During this phase, decode is not limited primarily by compute, but by memory bandwidth. Every single token requires reading the entire model out of VRAM.
Here’s the math: The RTX™ 4000 GPU has about 480 GBps of memory bandwidth. The Qwen2.5-7B-Instruct model (at 16-bit precision) is roughly 14 GB. That puts the theoretical ceiling at approximately 34 tokens per second for a single request. That ceiling exists because the GPU is bound by memory bandwidth and can’t read the weights any faster.
The math calculates the theoretical ceiling for generating the first token. In real-world scenarios, generation speed will start slightly slower — closer to 28–30 tokens per second — and will continue to drop as the model writes its response.
480 GB/s ÷ 14 GB = 34.28.
This happens because of how decode works. To generate a new token, the GPU has to read the 14 GB of model weights plus the KV cache it built from the initial prompt. Every time the model generates a new token, it appends that token's math to the KV cache.
The cache gets heavier as the response gets longer, and the GPU has to pull more data across that same 480 GBps pipe each step. That’s why generation speed (tokens per second) gradually slows down the longer the output gets.
Failure mode 1: Throughput flattens while latency climbs
Think of it like this: When one user sends one request, the GPU reads all 14 GB of model weights just to generate a single token for that one person. For the next token, it repeats the entire process. This giant memory read is the most expensive thing the GPU does and is actually one of the worst ways to use the hardware because, in this scenario, the rest of the GPU is underused.
Continuous batching fixes that. The GPU still runs one forward pass per output token, but now vLLM packs every in-flight request into that same pass. The 14 GB read still happens once, but the difference is that it now produces a token for every user in the batch at the same time. The system was already paying for that read, and batching stopped it from going to waste.
The measurements are shown in this table:
Concurrent users | Aggregate throughput | Per-user speed |
|---|---|---|
1 | 34 tok/s | 34 tok/s |
32 | ~525 tok/s | ~16 tok/s |
64 | ~1,041 tok/s | ~16 tok/s |
There are two stories in this table.
The aggregate column is the real win. One user gets 34 tokens per second out of the GPU. Sixty-four users get more than 1,000 with the same GPU. That’s roughly a 30x jump in what the hardware produces and the entire reason self-hosting an LLM makes economic sense today.
The per-user column is the trade-off. A single user inside a batch of 32 only sees about 16 tokens per second, which is slower than the 34 they would get if they had the GPU all to themselves. That means batching doesn't make any one request faster, but it does let the system serve a lot more people for the same amount.
For a real chat product, that trade is typically the goal — 16 tokens per second is still faster than anyone can read, and now the system is serving 32 people instead of one.
Batching does have a limit, though. As users keep arriving, requests will start showing up faster than the GPU can prefill them. This causes aggregate throughput to stop climbing because the GPU is already full. That extra load has nowhere to go, so it backs up into a queue. Once that happens, tail latency (that is,the slowest 5% of requests) starts to climb — and it doesn’t stop.
It’s known as the batching cliff: Throughput goes flat and latency keeps rising. The model and GPU are fine, but the cost shows up in the queue.
Failure mode 2: The KV cache runs out of room
The second failure is about memory.
Every in-flight request needs a KV cache, which is the running attention state for its conversation. That cache lives in GPU memory, in the same 20 GB pool that the 14 GB of model weights already occupy. In this setup, after the model loads, what’s left is a pool of about 38,800 tokens of KV cache. That pool is shared across every request in flight (Figure 2).
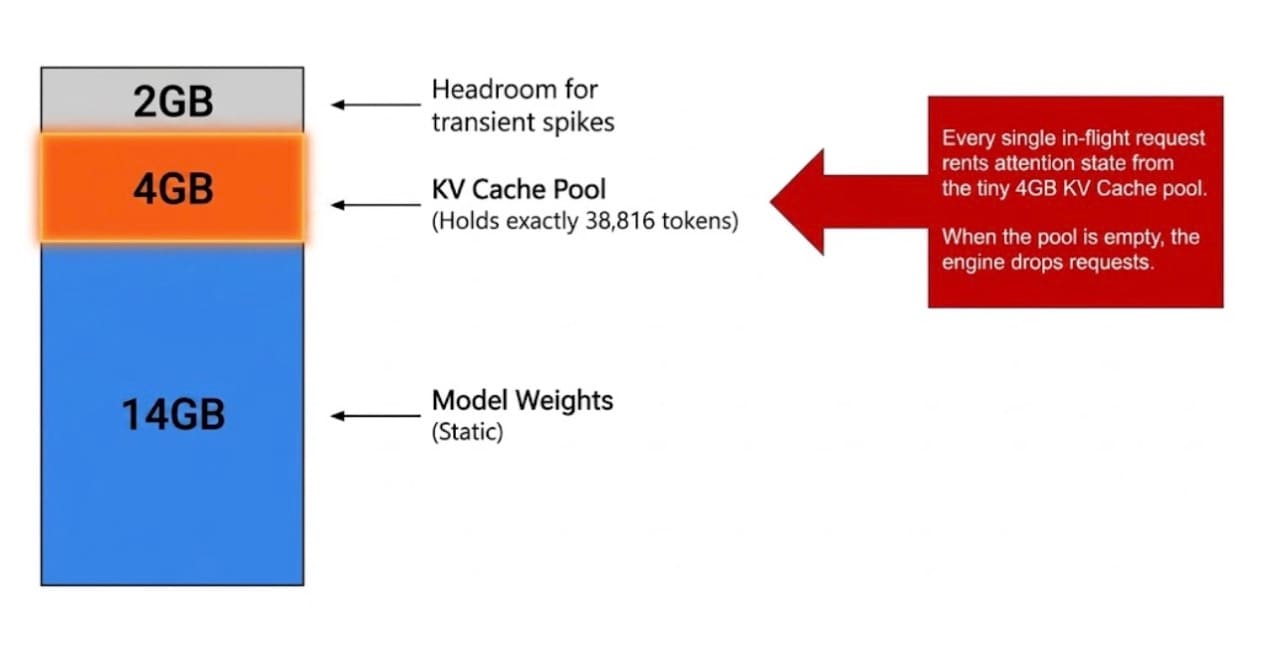 Fig. 2: Memory allocation: 14 GB for static model weights, 4 GB for the KV cache pool, and 2 GB for transient spike headroom
Here’s the math. Thirty-two concurrent users, each sending a 4,000-token prompt, demand 128,000 tokens of cache. The pool holds 38,800. I asked for more than three times what exists.
curl -s $ENDPOINT/metrics | grep cache_config_info
# vllm:cache_config_info{block_size="16",num_gpu_blocks="2426",...} 1.0
#
# 2426 blocks × 16 tokens per block = 38,816 tokensThis didn’t result in an error, but it was a slow and painful collapse in performance. The first nine or so requests landed in a few seconds, but then the TTFT climbed to 10 seconds, 20 seconds, 30 seconds, and finally flattened out around 55 seconds for everyone else. Every request past the ninth request waited for more than a minute. In production, that’s a P0 incident, but the error rate would have read zero the entire time.
Fix degraded inference with bounded admission
Compute and memory are two different bottlenecks, but they both showed the same symptom of latency degrading quietly.
The fix for both scenarios is the same: Cap what the engine accepts and queue everything else outside it.
In vLLM, that’s mostly one flag: --max-num-seqs. Set it to eight, and the engine admits a maximum of eight requests at a time. The ninth waits at the door, greatly improving the application's performance.
# Before — the naive deployment
args:
  - --model=Qwen/Qwen2.5-7B-Instruct
  - --api-key=$(VLLM_API_KEY)
  - --host=0.0.0.0
  - --port=8000

# After — bounded admission
args:
  - --model=Qwen/Qwen2.5-7B-Instruct
  - --api-key=$(VLLM_API_KEY)
  - --host=0.0.0.0
  - --port=8000
  - --max-num-seqs=8       # cap concurrent in-flight requests
- --max-model-len=8192 # cap context per requestA queue inside the engine grows without bound, and there isn’t much control over it. A queue outside the engine at the gateway, however, can be managed. It can shed, prioritize, rate-limit, or return a fast, honest “try again” instead of a silent 55-second hang — all while serving the same load on the same hardware. The only difference is where the work waits.
When the bounded config runs against the same workload, the admitted requests stay near baseline latency. The rest wait a predictable amount of time, the P95 stops climbing and plateaus, and the model never goes down. Instead, it just stops accepting work it can’t do well. This is the pattern needed by any production LLM serving, and vLLM gives teams the flags to do it cleanly.
Design for inference failure from day 1
Self-hosting an LLM isn’t hard to start and privacy, cost, and compliance are all valid reasons to take this approach. However, it can be a challenge to run under real traffic at scale.
The difficulty isn’t where many teams expect — it’s not in the deployment
Rather, the difficulty is in understanding that endpoints can be fully degraded while every health check is green. It also includes knowing whether the system is out of compute or memory, because the symptoms are identical but the fix depends on the cause. The recovery pattern is bounded admission and queueing at the gateway. This is something you design on day one, not something you bolt on after the first bad afternoon.
Try it on Akamai Cloud
Everything here is reproducible. The full setup, including the Terraform, Kubernetes manifests, load-testing scripts, and monitoring stack, is in a public repo.
Akamai Cloud has free sign-up with US$300 in credits.
Stand up the cluster, deploy the model, then put it under load and watch it break. That’s where the learning happens.

Tags