Load balancers have long handled traffic distribution for traditional web applications — ensuring high availability, spreading load, and keeping services responsive. But AI inference workloads are changing the shape of traffic itself.
Inference-heavy systems generate highly concurrent, bursty, and latency-sensitive traffic. Requests are no longer tied to human interaction patterns — they’re driven by autonomous systems that are making real-time decisions. In this environment, understanding how traffic behaves at the load balancer layer becomes critical.
Introducing Akamai Cloud Pulse metrics for NodeBalancers
We are excited to announce that Akamai Cloud Pulse metrics for NodeBalancers are now in limited availability across all core regions. With this integration, cloud architects, DevOps engineers, and site reliability engineers (SREs) gain centralized, quantitative data about Akamai NodeBalancers performance.
Whether you are monitoring complex session behaviors, mitigating traffic bottlenecks, or ensuring the back-end health of your AI application, Akamai Cloud Pulse gives you the visibility required to operate seamlessly.
Observability for the agentic web
In traditional applications, traffic patterns are largely predictable; they are driven by human activity and gradual use changes. However, in the era of the agentic web, AI agents perform autonomous actions, meaning that request and traffic patterns differ.
Requests are triggered programmatically (not by users)
AI agents generate parallel API calls (fan-out behavior)
Traffic spikes are sudden and nonlinear
Latency directly impacts model performance and user experience
This makes the load balancer a critical control point. Without visibility into connection-level behavior:
Traffic bursts go undetected until latency spikes
Back-end saturation appears too late
Scaling decisions become reactive instead of proactive
If a load balancer cannot distribute traffic efficiently during a massive burst of inference requests, the entire AI application suffers from unacceptable latency, degrading the user experience and potentially interrupting critical autonomous tasks.
In this volatile environment, NodeBalancers metrics — specifically monitoring session spikes and back-end health — are critical for ensuring that latency-sensitive inference calls do not bottleneck.
Reference architecture: AI inference with distributed GPU clusters
A common architecture for AI inference systems includes:
Global routing (DNS or edge) directing users to the nearest region
Regional load balancing using Akamai NodeBalancers
Back-end pools of GPU-enabled compute nodes that are handling inference
Each region operates independently for latency and fault isolation.
Why this architecture works
Reduces inference latency by serving traffic locally
Prevents cascading failures across regions
Enables independent scaling of GPU clusters
Where NodeBalancers fits
At the regional level, NodeBalancers:
Distributes incoming TCP/UDP traffic
Routes traffic to healthy GPU nodes
Removes failing nodes via health checks
With real-time metrics, NodeBalancers becomes more than a routing layer — it becomes a signal source for system health and scaling decisions.
Key metrics for AI workload observability
Akamai Cloud Pulse provides Layer 4 (transport layer ) metrics that expose how traffic behaves before it impacts application performance:
Traffic volume (ingress/egress)
Burst detection (new sessions)
Concurrency (active sessions)
Serving capacity (active back ends)
This mapping helps teams reason about system behavior and make faster, more accurate scaling decisions.
Traffic volume (ingress/egress)
Ingress traffic rate
Egress traffic rate
TCP/UDP breakdown
These metrics show how much data is flowing through the system.
Why it matters for AI
Sudden increases often indicate fan-out behavior, where AI agents trigger multiple inference requests simultaneously.
Figure 1 shows how these metrics appear in real-time dashboards.
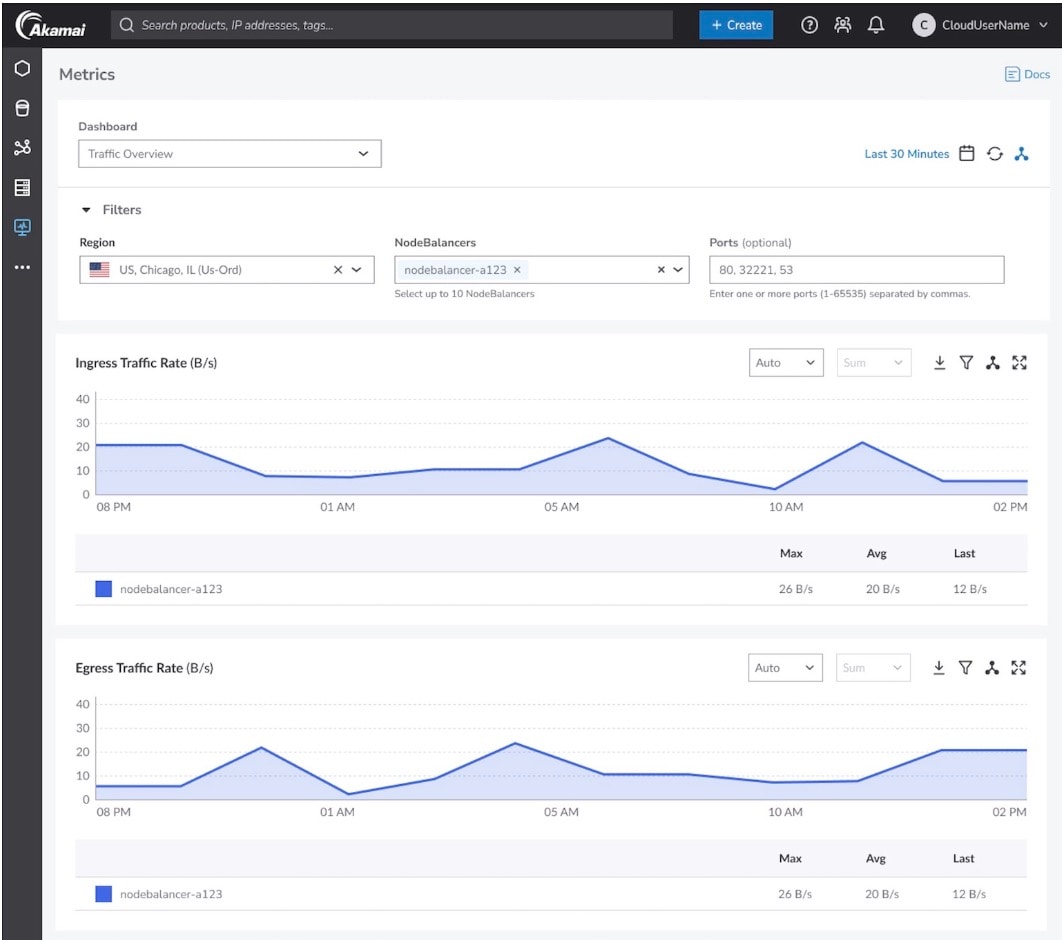 Fig. 1: Real-time traffic analysis dashboard showing ingress and egress traffic rates across TCP and UDP, helping teams monitor load distribution and quickly detect sudden traffic spikes in AI-driven systems
Burst detection (new sessions)
New sessions
New TCP sessions
New UDP sessions
These metrics act as early warning signals.
Why it matters for AI
Spikes in new sessions often precede:
Back-end overload
Increased latency
Connection drops
This makes them critical for proactive scaling.
Concurrency (active sessions)
Total active sessions
Active TCP sessions
Active UDP sessions
These represent real-time connection load on your infrastructure.
Why it matters for AI
High concurrency indicates:
Sustained inference demand
Long-lived connections
Potential pressure on back-end systems
Serving capacity (active back ends)
Total active back ends
Active TCP back ends
Active UDP back ends
These metrics show how many back-end nodes are healthy and serving traffic (Figure 2).
Why it matters for AI
A drop in active back ends is often the first sign of:
GPU node failures
Failed health checks
Resource exhaustion
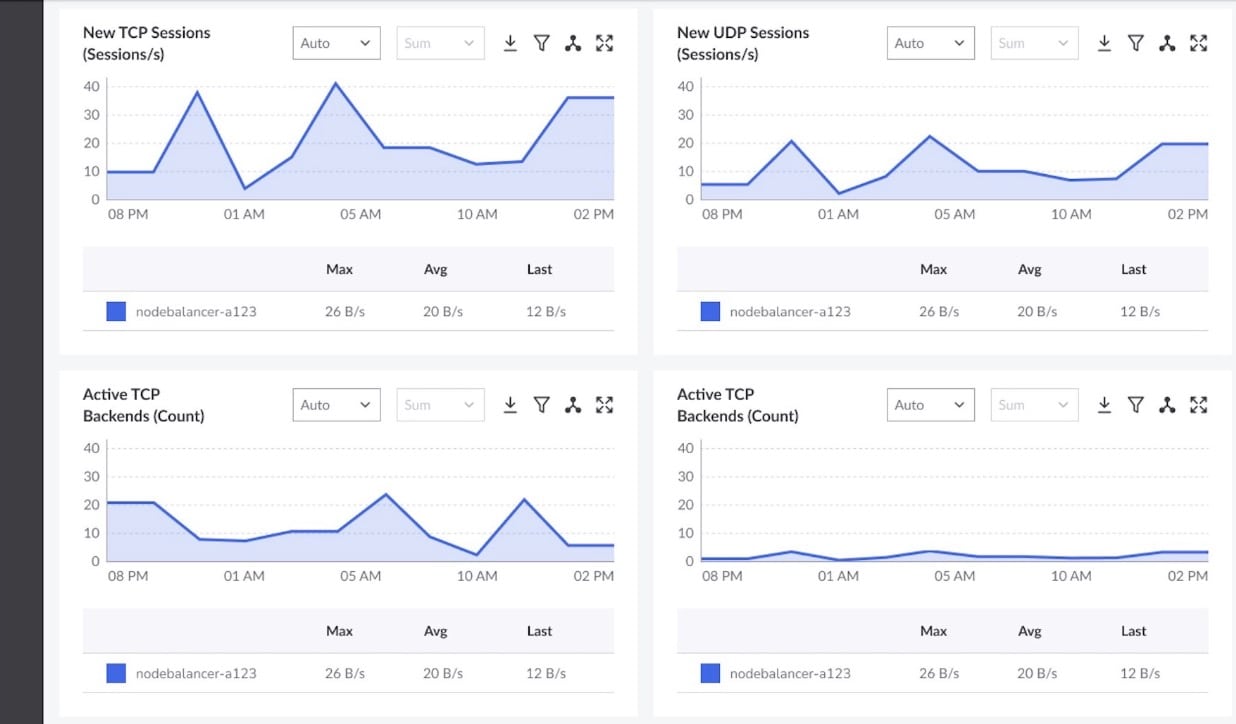 Fig. 2: Session management and back-end health metrics, including new TCP/UDP sessions and active back ends, enable teams to detect burst traffic early and identify back-end saturation before it impacts inference latency
Built for your workflow
We know that every engineering team has its own way of monitoring infrastructure. That’s why we’ve made NodeBalancers metrics highly flexible with:
Native dashboards: View your metrics instantly within the Akamai Cloud Pulse user interface by using customizable dashboards, date ranges, and grouping filters (Figure 3).
OpenTelemetry integrations: Export metrics using OTel Collector and expose them in Prometheus-compatible formats, enabling integration with tools like Grafana.
Programmatic access: Retrieve your metrics programmatically using the Akamai Cloud API (built on legacy Linode infrastructure) to automate your monitoring and alerting workflows.
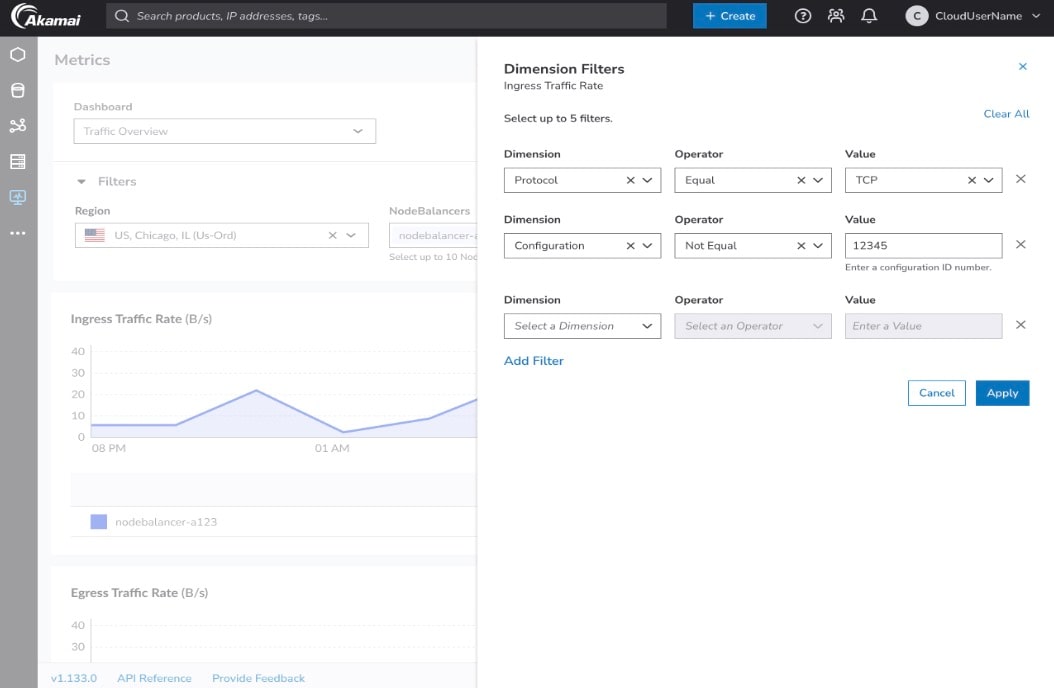 Fig. 3: Flexible dashboard filters and grouping capabilities allow teams to customize views, analyze NodeBalancers metrics across dimensions, and adapt monitoring workflows to their specific infrastructure needs
A growing observability ecosystem
Akamai NodeBalancers joins a growing list of services supported by Akamai Cloud Pulse metrics, which currently includes Managed Database Services and Akamai Object Storage. By bringing these resources into a centralized monitoring environment, we are making it easier than ever to monitor the holistic health of your Akamai Cloud environment.
Get started today
Ready to gain deeper insights into your traffic routing? Check out the resources below to start exploring NodeBalancers metrics on Akamai Cloud Pulse:
As AI workloads continue to evolve, real-time visibility at the load balancer layer will play an increasingly critical role in maintaining performance and reliability. Log in to your Cloud Manager today to explore NodeBalancers metrics in Akamai Cloud Pulse to better understand and optimize your traffic at scale.

Tags